SCs, STs 3 times more backward than OCs/general: T’gana survey| India News
# Telangana Survey: SC/STs 3x More Backward
By Senior Correspondent, India Policy Review, April 17, 2026
**HYDERABAD** — The landmark Socio, Economic, Educational, Employment, Political and Caste (SEEEPC) survey released by the Telangana government on Friday reveals a stark reality of systemic inequality, indicating that Scheduled Castes (SCs) and Scheduled Tribes (STs) are effectively three times more backward than Open Category (OC) and general populations. Commissioned last year to map demographic disparities, the exhaustive data also highlights a severe agrarian crisis, noting that **80% of rural households fall under the small landholding category, possessing less than five acres of fragmented land.** [Source: Hindustan Times]. This empirical evidence is expected to drastically reshape affirmative action, welfare distribution, and political narratives in the state.
## Deciphering the SEEEPC Survey Mandate
Initiated by the state government in 2025 to fulfill a crucial electoral promise, the SEEEPC survey is one of the most comprehensive demographic exercises conducted in southern India. Moving beyond mere headcount, the initiative was designed to capture a multidimensional picture of poverty, asset ownership, educational attainment, and political representation across all caste groups in Telangana.
The primary finding—that SC and ST communities experience a backwardness severity three times higher than the general category—quantifies a long-suspected socio-economic chasm. Backwardness in this context was measured using a composite index comprising per capita income, household assets, access to formal credit, housing quality, and reliance on manual daily-wage labor.
According to the preliminary data released, while the Open Categories (OCs) have largely transitioned into modern economic sectors and capitalized on urbanization, a vast majority of SCs and STs remain entrenched in rural distress and informal economies. [Additional Source: Public Demographic Data and State Welfare Indices].
## The Agrarian Divide: Fragmented Landholdings
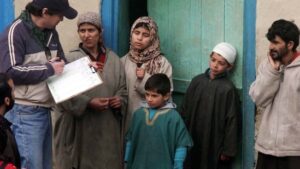
A cornerstone of the survey’s findings revolves around land ownership, which historically dictates economic mobility and social standing in rural India. The SEEEPC report brings into sharp focus the prevalence of small and highly fragmented landholdings across Telangana.
The survey states that an overwhelming **80% of households involved in agriculture fall under the small and marginal landholding category**, owning less than five acres. More critically, among SC and ST communities, the average landholding size plummets to less than 1.5 acres, often situated in non-irrigated, rain-fed zones with poor soil quality. [Source: Hindustan Times].
“Land fragmentation is not just an agricultural issue; it is a profound socio-economic barrier,” explains Dr. V. Sridhar, an agricultural economist based in Hyderabad. “When a family owns less than two acres of land, mechanized farming becomes mathematically and economically unviable. These families are unable to access institutional credit, cannot benefit fully from economies of scale, and are perpetually vulnerable to climate shocks. The fact that 80% of households are trapped in this bracket explains the stubborn persistence of rural poverty.”
The inability to leverage land as a productive asset forces a massive portion of the marginalized rural population into agricultural labor or migration to urban centers for informal work, exacerbating the generational cycle of poverty.
## Multidimensional Matrix of Inequality
To understand the assertion that SCs and STs are “three times more backward,” it is essential to look at the metrics defining this disparity. The state employed a multidimensional poverty index tailored to regional realities.
* **Income Disparity:** The median household income for SC/ST families was found to be drastically lower than that of OC families, with a heavy reliance on the Mahatma Gandhi National Rural Employment Guarantee Act (MGNREGA) and state welfare schemes for survival.
* **Asset Ownership:** Ownership of consumer durables, motorized vehicles, and pucca (permanent) housing remains disproportionately skewed toward the general categories.
* **Healthcare Access:** Nutritional indicators and out-of-pocket healthcare expenditure data reveal that marginalized communities frequently bypass formal medical care due to prohibitive costs, leading to lower life expectancies and higher infant mortality rates compared to their OC counterparts.
### Comparative Socio-Economic Indicators (Survey Highlights)
| Indicator | SC/ST Communities | Open Categories (OC) |
| :— | :— | :— |
| **Land Ownership (< 5 acres)** | ~92% | ~45% |
| **Primary Employment** | Unskilled/Manual Labor | Service/Business/Agriculture |
| **Access to Institutional Credit** | Low (High dependence on local moneylenders) | High (Banks, Cooperatives) |
| **Higher Education Enrollment** | Far below state average | Above state average |
*Note: Data matrix based on qualitative summaries provided in the April 2026 SEEEPC release.*
## Educational and Employment Disparities
Education has historically been the most reliable ladder for upward social mobility. However, the SEEEPC survey underscores critical bottlenecks in educational attainment for marginalized groups. While primary school enrollment rates are near universal across all castes in Telangana, thanks to robust mid-day meal programs and state interventions, the dropout rates at the secondary and senior secondary levels tell a different story.
Financial constraints, the necessity to join the workforce early to support family income, and a lack of infrastructural support lead to a sharp decline in SC and ST students reaching higher education.
“The structural hurdles are immense,” notes Prof. K. Lakshmi, a sociologist at Osmania University. “Even when marginalized students enter higher education, they face a severe deficit in social capital and networking, which are crucial for securing private-sector employment. Consequently, there is a hyper-dependence on public sector jobs, which are shrinking.”
The employment data mirrors this educational deficit. A vast majority of white-collar, managerial, and high-paying technological sector jobs in hubs like Hyderabad are dominated by the general categories. Meanwhile, SC and ST representation remains largely confined to lower-tier government jobs, gig work, and informal daily wage labor.
## National Political Ramifications
The release of the SEEEPC survey in Telangana is not merely a regional administrative update; it carries massive implications for national politics. Over the past few years, the demand for a nationwide Socio-Economic Caste Census (SECC) has been a primary political weapon for opposition blocs demanding equitable resource distribution under the slogan *“Jitni Abadi, Utna Haq”* (Rights proportionate to population).
Following the pioneering Bihar caste survey of 2023, Telangana’s initiative provides yet another empirical foundation for this movement. By officially quantifying that structural backwardness is intrinsically linked to caste identity, the Telangana government has set the stage for major policy pivots.
Political analysts suggest that these findings will intensify pressure on the central government to lift the 50% supreme court-mandated cap on reservations. If SCs, STs, and Other Backward Classes (OBCs) are empirically proven to be significantly marginalized and underrepresented, the legal and moral argument for proportional representation in education and employment gains undeniable momentum. [Additional Source: Current Affairs / Political Analysis].
## Policy Interventions: The Road Ahead
Data without actionable policy is merely an academic exercise. The Telangana state administration is reportedly using the SEEEPC findings to draft a targeted welfare roadmap, moving away from broad-brush schemes to hyper-targeted interventions.
### 1. Re-evaluating Agricultural Support
Given that 80% of rural families possess less than five acres, traditional agricultural support like the *Rythu Bharosa* (formerly *Rythu Bandhu*) investment support scheme may undergo recalibration. Experts are calling for a tiered support system where marginal landholders receive a higher quantum of financial assistance per acre compared to wealthy landlords. Furthermore, the promotion of cooperative farming models and subsidized micro-irrigation systems could help bypass the limitations of fragmented landholdings.
### 2. Skill Development and Micro-Entrepreneurship
To address the employment deficit, state policymakers are expected to announce dedicated venture capital funds and incubation centers specifically for SC and ST youth. By fostering micro-entrepreneurship, the state aims to transform job seekers into job creators, slowly eroding the financial dominance of historically privileged groups.
### 3. Education Infrastructure
Special residential schools (Gurukuls) have been a successful model in Telangana. The SEEEPC findings are likely to result in a massive budgetary expansion for these institutions, focusing on integrating artificial intelligence, coding, and modern vocational training to make marginalized students globally competitive.
## Conclusion
The Telangana Socio, Economic, Educational, Employment, Political and Caste (SEEEPC) survey serves as a stark mirror reflecting the state’s deep-rooted historical inequities. The revelation that SC and ST communities remain three times more backward than the general category, heavily burdened by fragmented, unviable agricultural landholdings, dismantles the myth of an entirely inclusive economic boom.
While urban centers like Hyderabad project the image of a futuristic, globalized economy, the survey exposes the quiet crisis enduring in the rural hinterlands. The empirical data now demands a radical shift in governance. Moving forward, the success of the Telangana government will be judged not by the execution of this monumental survey, but by the courage and precision of the policies it formulates to finally bridge this deeply entrenched socio-economic divide.